Ancient sources contain numerous astronomical observations that can be used to establish absolute dates. Solar eclipses are particularly important in this context. In antiquity, eclipses were often perceived as a threat and bad omen, causing fear and potentially political disturbances. By far not every partial solar eclipse has been noticed by an unprepared observer. Changes in ambient illumination remain relatively inconspicuous until a large part of the solar disk is covered. Even when about three quarters of the Sun’s area is obscured, the reduction in daylight may still pass largely unnoticed with the most dramatic changes in illumination occuring only during the very deep partial phases close to totality. Historical visibility must be understood primarily in terms of the conspicuous environmental effects of a deep eclipse—diminished and altered daylight, unusual shadows, and, near totality, a pronounced twilight-like appearance. These facts make eclipses of high magnitude particularly relevant when considering events that could have attracted widespread attention without advance knowledge of the phenomenon. A series of such high magnitude solar eclipses at a certain location within a limited number of years is a rare phenomenon. Such eclipse series have been interpreted to being the cause of political disturbances.
This tutorial will show you how to identify such sequences of notable eclipses step-by-step based on pre-calculated tables which are available for the following locations relevant for classical antiquity: Alexandria, Amarna, Assur, Athens, Babylon, Jerusalem, Knossos, Mari, Memphis, Rome, and Thebes. The data are deposited in DaSCH’s repository DSP (Gautschy). The dataset contains calculations of notable solar eclipses for the period between 2500 BCE and 1000 CE. It is a solar eclipse canon with identifications of the eclipses recorded in historical sources. Gautschy 2012 discusses two examples of the solar eclipse canon’s application. If you want to know more about the basics of eclipses, Gautschy provides an introduction to eclipse geometry and the underlying calculations.
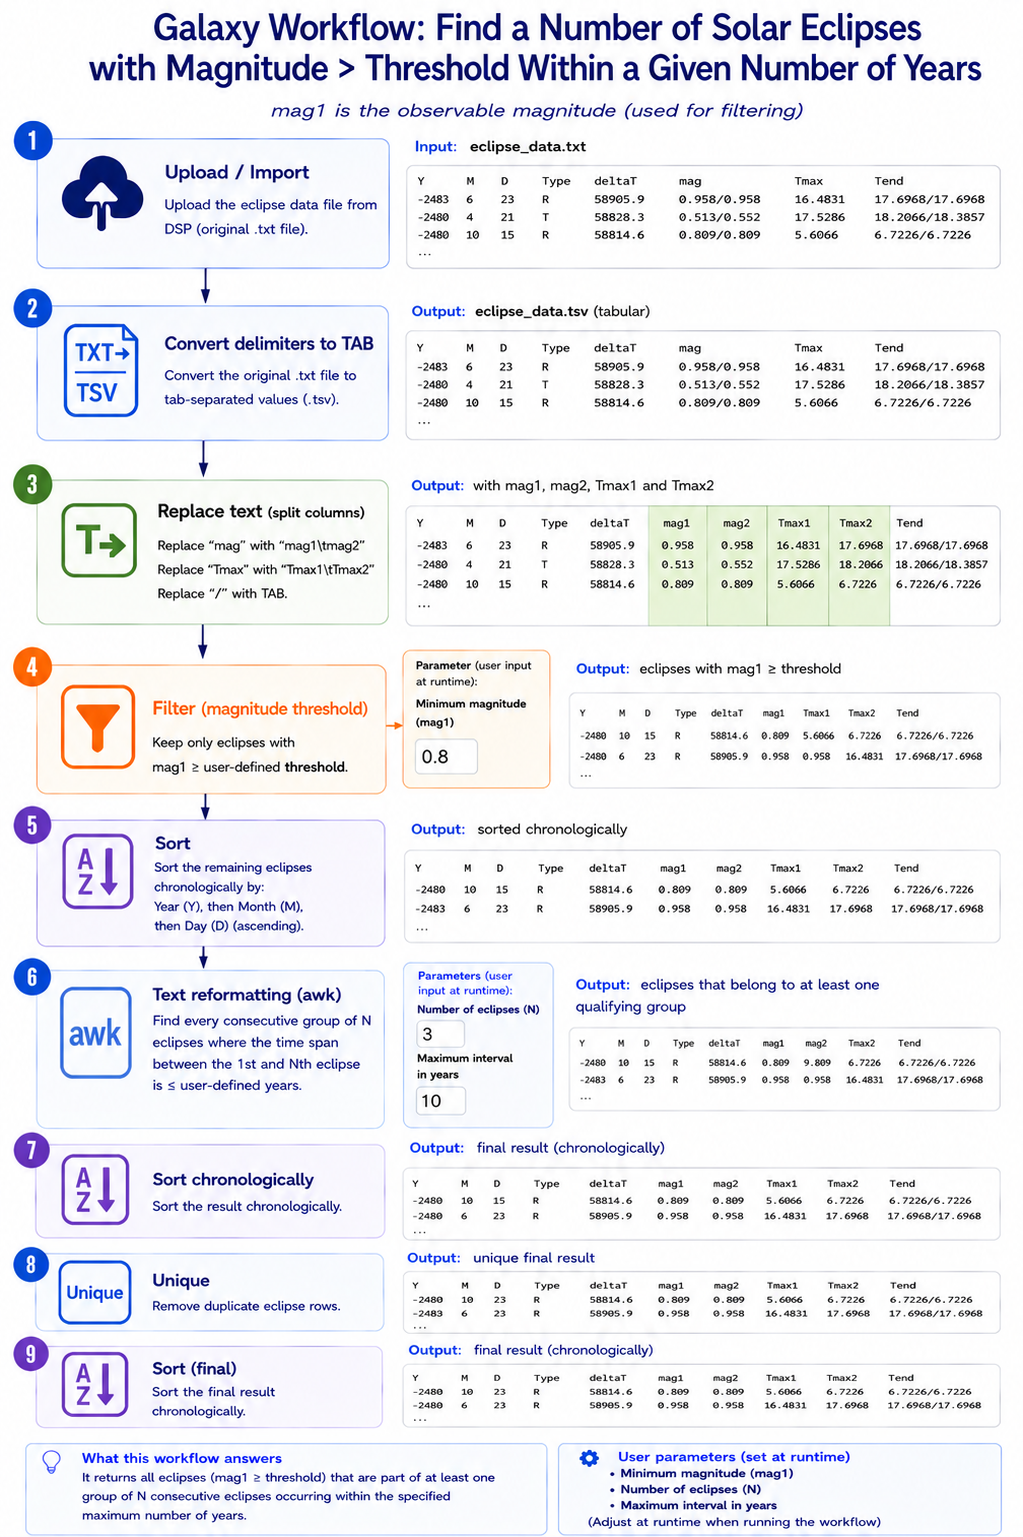
Analysing Solar Eclipse Frequency with a Galaxy Workflow
Solar eclipses can be relevant to historical and chronological
investigations. For example, one may ask whether several conspicuous
eclipses occurred within a relatively short period of time. In antiquity,
eclipses were often perceived as a bad omen, as signs of the dissatisfaction
of the gods with a ruler. Therefore, an unusual sequence of
remarkable eclipses could have had drastic consequences.
In this tutorial, we use pre-calculated solar-eclipse data and a Galaxy
workflow to answer a configurable question:
Which eclipses with an observable magnitude at or above a chosen
threshold belong to a group of N consecutive eclipses occurring within
at most X years?
The published workflow is parameterised. Instead of fixing a
particular threshold, number of eclipses, or time interval in the
workflow, you can supply these values at runtime.
The input data
The source data are pre-calculated lists of solar eclipses for locations
relevant to classical antiquity, covering 2500 BCE to 1000 CE available
in DaSCH’s DSP repository. Files can be fetched from DSP or first
downloaded there and uploaded from the local computer.
As an alternative to uploading the data from a URL or your computer, the files may also have been made available from a shared data library:
Go into Libraries (left panel)
Navigate to the correct folder as indicated by your instructor.
On most Galaxies tutorial data will be provided in a folder named GTN - Material –> Topic Name -> Tutorial Name.
Select the desired files
Click on Add to Historygalaxy-dropdown near the top and select as Datasets from the dropdown menu
In the pop-up window, choose
“Select history”: the history you want to import the data to (or create a new one)
Click on Import
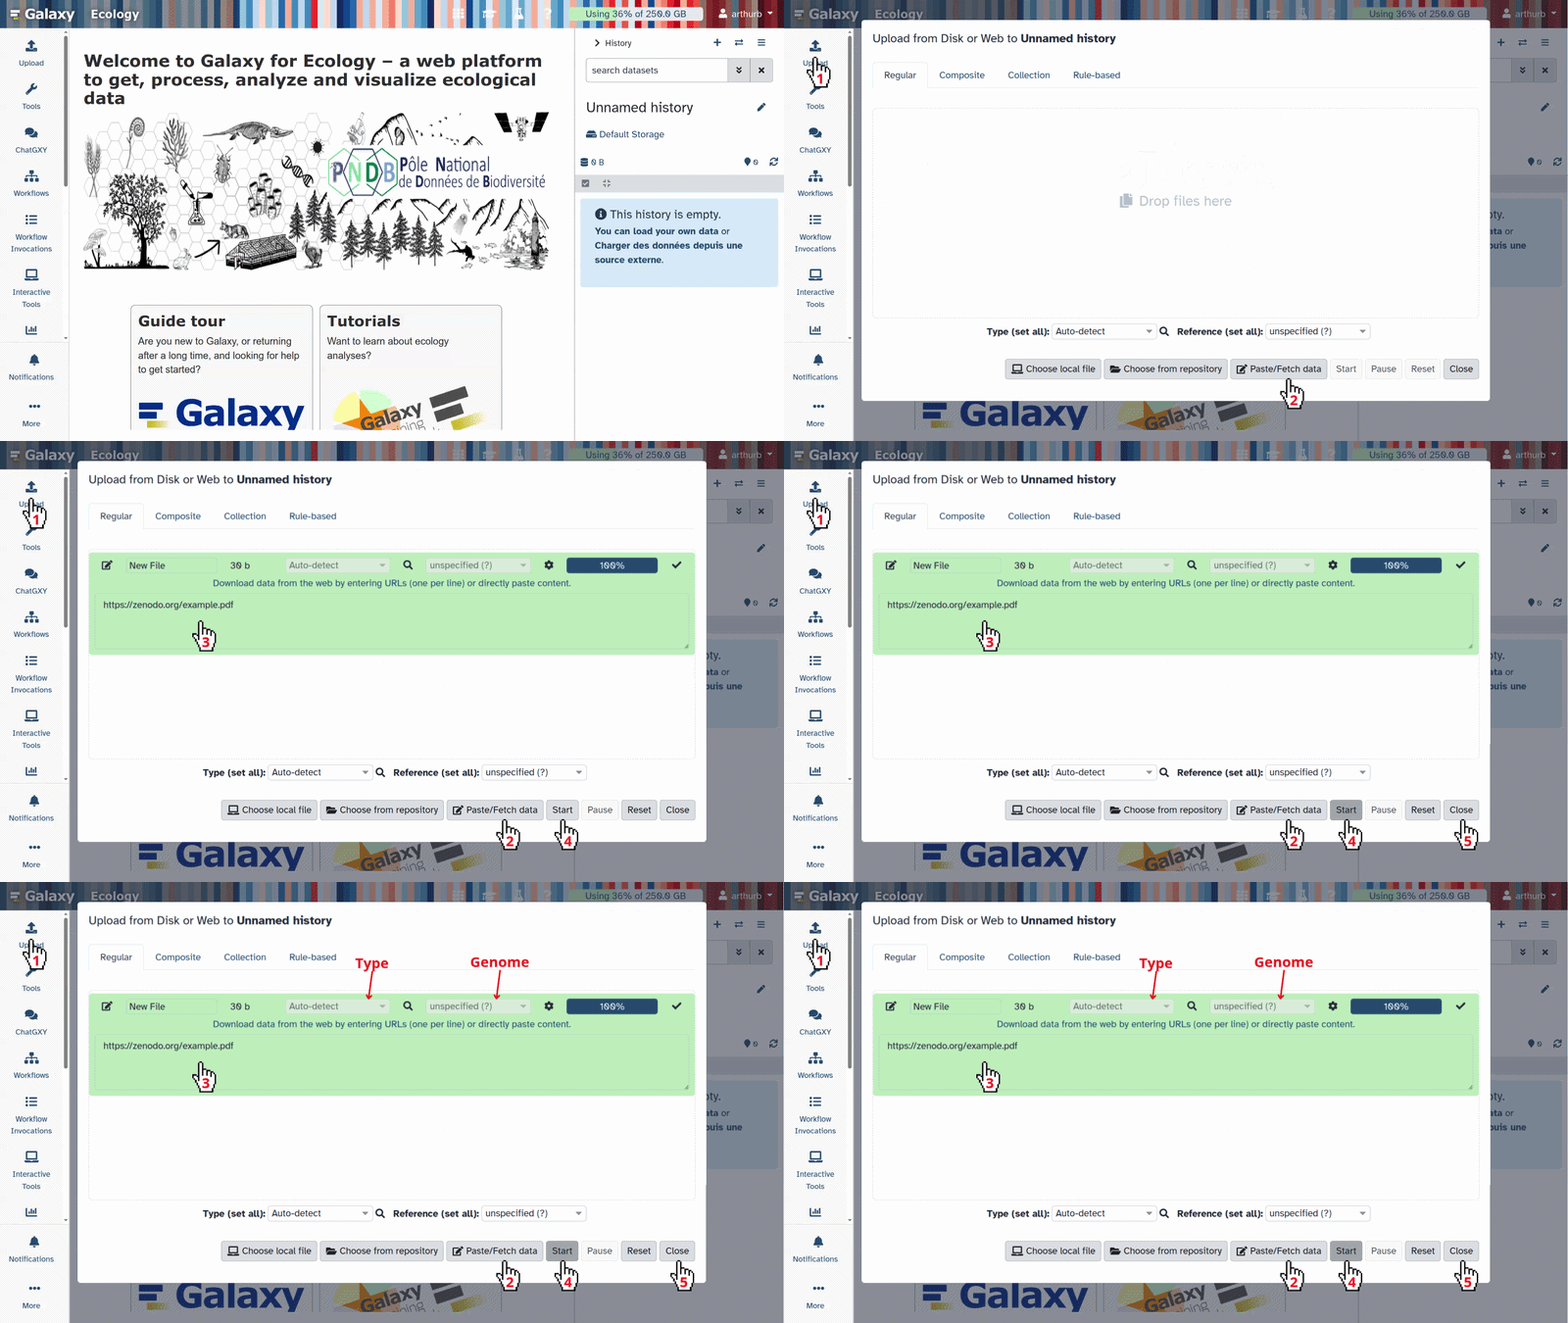
Copy the link location
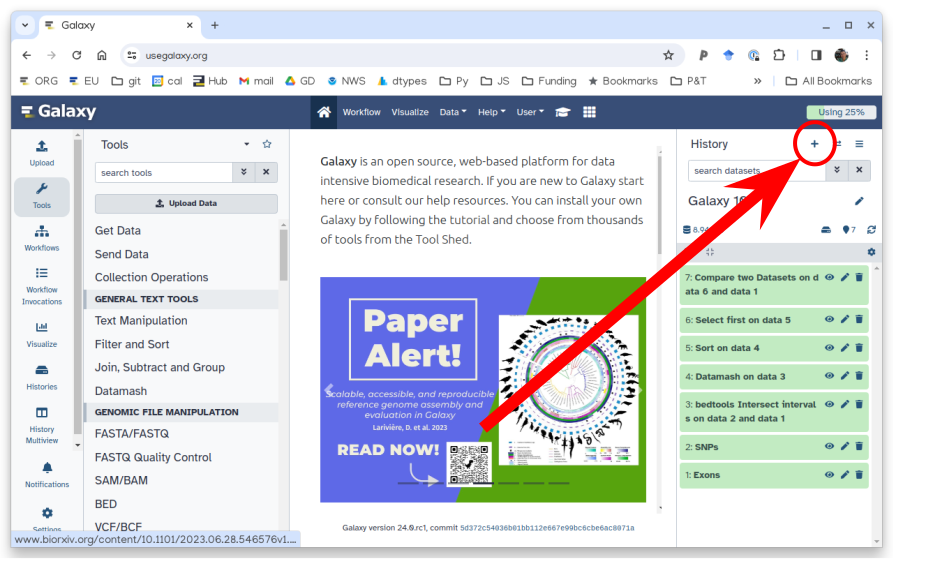
Click galaxy-uploadUpload at the top of the activity panel
Select galaxy-wf-editPaste/Fetch Data
Paste the link(s) into the text field
Press Start
Close the window
Be sure to choose a source file whose pre-calculated lower magnitude limit does not exclude eclipses you
want to investigate. For example, a study threshold of 0.85 requires a source list calculated with a threshold of 0.8 or lower.
Once you click start, your upload should begin. It will first turn orange while in progress, then turn green once it is successfully uploaded. After this step you should have one file in your History.
Step 2: Convert the text file to tabular data
The original .txt file is converted into a tab-separated format suitable for subsequent Galaxy tools by changing the spaces/whitespaces to tabs. The output is a tabular dataset.
Hands On: Convert the file
Convert delimiters to TAB with the following parameters:
param-file“Convert all”: Whitespaces
“in Dataset”: origin (Input dataset) tool
Click “Run Tool”.
Comment:
The original .txt file is converted into a tab-separated format suitable for subsequent Galaxy tools by changing
the spaces/whitespaces to tabs. The output is a tabular dataset.
Step 3: Separate observable and theoretical magnitude
The original mag and Tmax columns contain two values separated by /. A [Replace text] step splits the mag field and creates the columns
mag1 and mag2. The two Tmax values correspond to the two mag values, they are split as well, but not used further during the workflow.
Hands On: Separate observable and theoretical magnitude
Replace Text in entire line ( Galaxy version 9.5+galaxy3) with the following parameters:
param-file“File to process”: Convert on dataset 1 (output
of Convert delimiters to TABtool)
In “Replacement”:
param-repeat“Replacement”
“Find pattern”: mag
“Replace with:”: mag1\tmag2
param-repeat“Insert Replacement”
“Find pattern”: Tmax
“Replace with:”: Tmax1\tTmax2
param-repeat“Insert Replacement”
“Find pattern”: /
“Replace with:”: \t
Regular expressions are a standardized way of describing patterns in textual data. They can be extremely useful for tasks such as finding and replacing data. They can be a bit tricky to master, but learning even just a few of the basics can help you get the most out of Galaxy.
Finding
Below are just a few examples of basic expressions:
Regular expression
Matches
abc
an occurrence of abc within your data
(abc|def)
abcordef
[abc]
a single character which is either a, b, or c
[^abc]
a character that is NOT a, b, nor c
[a-z]
any lowercase letter
[a-zA-Z]
any letter (upper or lower case)
[0-9]
numbers 0-9
\d
any digit (same as [0-9])
\D
any non-digit character
\w
any alphanumeric character
\W
any non-alphanumeric character
\s
any whitespace
\S
any non-whitespace character
.
any character
\.
literal . (period)
{x,y}
between x and y repetitions
^
the beginning of the line
$
the end of the line
Note: you see that characters such as *, ?, ., + etc have a special meaning in a regular expression. If you want to match on those characters, you can escape them with a backslash. So \? matches the question mark character exactly.
Examples
Regular expression
matches
\d{4}
4 digits (e.g. a year)
chr\d{1,2}
chr followed by 1 or 2 digits
.*abc$
anything with abc at the end of the line
^$
empty line
^>.*
Line starting with > (e.g. Fasta header)
^[^>].*
Line not starting with > (e.g. Fasta sequence)
Replacing
Sometimes you need to capture the exact value you matched on, in order to use it in your replacement, we do this using capture groups (...), which we can refer to using \1, \2 etc for the first and second captured values. If you want to refer to the whole match, use &.
Regular expression
Input
Captures
chr(\d{1,2})
chr14
\1 = 14
(\d{2}) July (\d{4})
24 July 1984
\1 = 24, \2 = 1984
An expression like s/find/replacement/g indicates a replacement expression, this will search (s) for any occurrence of find, and replace it with replacement. It will do this globally (g) which means it doesn’t stop after the first match.
Example: s/chr(\d{1,2})/CHR\1/g will replace chr14 with CHR14 etc.
You can also use replacement modifier such as convert to lower case \L or upper case \U. Example: s/.*/\U&/g will convert the whole text to upper case.
Note: In Galaxy, you are often asked to provide the find and replacement expressions separately, so you don’t have to use the s/../../g structure.
There is a lot more you can do with regular expressions, and there are a few different flavours in different tools/programming languages, but these are the most important basics that will already allow you to do many of the tasks you might need in your analysis.
Tip:RegexOne is a nice interactive tutorial to learn the basics of regular expressions.
Tip:Regex101.com is a great resource for interactively testing and constructing your regular expressions, it even provides an explanation of a regular expression if you provide one.
Tip:Cyrilex is a visual regular expression tester.
The resulting table has the structure:
Y M D Type deltaT mag1 mag2 Tbeg Tmax1 Tmax2 Tend SR SS
Step 4: Select eclipses above the magnitude threshold
Hands On: Select eclipses above the magnitude threshold
The workflow uses a Filter step to select all eclipses with a magnitude greater or equal to a user-supplied Magnitude threshold.
Filter data with the following parameters:
param-file“Filter *“: Replace Text on dataset (output of Replace Text in entire linetool)
“With following condition”: c6>=0.8
“Number of header lines to skip”: 1
Comment: About the parameters
You have to set the number of header lines to 1 in order to skip the header.
The condition states that the value in column 6 of the file has to be greater than or equal to 0.8
Question
What has to change in the condition if the import file has no header?
What has to change in the condition if column 7 would contain the magnitudes and not column 6?
In “Number of header lines to skip”: 0
In “With following condition”: c7>=0.8
Step 5: Sort the eclipses chronologically
The remaining eclipses must be in chronological order before consecutive
groups can be identified.
Hands On: Sort the eclipses chronologically
Sort data in ascending or descending order ( Galaxy version 9.11+galaxy0) with the following parameters:
param-file“Sort Query”: Filter on dataset (output of Filtertool)
“Number of header lines”: 1
“1: Column Selections”
“Sort on column”: c1
“in”: Ascending order
param-repeat Insert Column selections
“2: Column Selections”
“Sort on column”: c2
“in”: Ascending order
param-repeat Insert Column selections
“3: Column Selections”
“Sort on column”: c3
“in”: Ascending order
Comment:
The configured numeric ascending sorts in this order:
Column 1: Year (Y),
Column 2: Month (M),
Column 3: Day (D).
The header line is skipped. This produces a chronologically ordered sequence of eclipses satisfying the magnitude criterion.
Step 6: Find groups of eclipses
This is the central analytical step of the workflow. You have to supply as input:
Number of eclipses (N)
Maximum interval in years (X)
Both are connected to variables in a Text reformatting with awk
step.
For each possible sequence of N consecutive eclipses, the workflow
compares the year of the Nth eclipse with the year of the first eclipse:
year[N] - year[1] <= X
If the condition is satisfied, all eclipses in that group are returned.
Hands On: Find groups of eclipses
Text reformatting - with awk ( Galaxy version 9.5+galaxy3) with the following parameters:
param-file“File to process”: Sort in dataset (output of Sorttool)
“AWK Program”:
BEGIN { OFS="\t"
  n = VAR1
  years = VAR2
}
NR == 1 {
 next
}
{
  year[NR-1] = $1
  line[NR-1] = $0
  count = NR-1
}
END {
  for (i=1; i<=count-n+1; i++) {
    if (year[i+n-1] - year[i] <= years) {
      for (j=i; j<=i+n-1; j++) {
        print line[j]
      }
    }
  }
}
In ”+ Insert variables”: 3
In ”+ Insert variables”: 10
Comment: What counts as a group?
With 3 (N) and 10 (years), the workflow examines every three
consecutive eclipses in the magnitude-filtered chronological list.
A group qualifies when the year difference between its first and third
eclipse is no more than ten years. There may be overlapping groups because an eclipse can belong to more than one qualifying group.
For example, if eclipses A-B-C qualify and B-C-D also qualify, B and C are emitted twice by the group-selection step.
This is intentional: the group-selection step first identifies all
qualifying windows. The next steps will collapse repeated eclipse rows.
Step 7: Sort chronologically
The grouping destroyed the chronological order and some eclipses are listed more than once. The list needs to be sorted to be prepared for the following step.
Hands On: Sort chronologically
Sort data in ascending or descending order ( Galaxy version 9.11+galaxy0) with the following parameters:
param-file“Sort Query”: Text reformatting on dataset (output of Text reformattingtool)
“Number of header lines”: 0
“1: Column Selections”
“Sort on column”: c1
“in”: Ascending order
param-repeat Insert Column selections
“2: Column Selections”
“Sort on column”: c2
“in”: Ascending order
param-repeat Insert Column selections
“3: Column Selections”
“Sort on column”: c3
“in”: Ascending order
Comment: About the output
The configured numeric ascending sorts in this order:
Column 1: Year (Y),
Column 2: Month (M),
Column 3: Day (D).
This produces a chronologically ordered sequence of eclipses. Some of them are listed more than once.
No header line needs to be skipped because the Text reformatting tool eliminated the header.
Step 8: Remove duplicate eclipse rows
A Unique step removes repeated rows if the list is sorted well.
Hands On: Remove duplicates
Unique occurrences of each record ( Galaxy version 9.5+galaxy3) with the following parameters:
param-file“File to scan for unique values *“: Sort on dataset (output of Sorttool)
“Avoid comparing the first N fields *“: 0
Comment: About the output
This produces a list with each eclipse only occuring once, but not in chronological order.
Step 9: Sort the final result
Because the duplicate-removal step does not preserve chronological order, the result is sorted once more.
Hands On: Sort chronologically
Sort data in ascending or descending order ( Galaxy version 9.11+galaxy0) with the following parameters:
param-file“Sort Query”: Unique on dataset (output of Uniquetool)
“Number of header lines”: 0
“1: Column Selections”
“Sort on column”: c1
“in”: Ascending order
param-repeat Insert Column selections
“2: Column Selections”
“Sort on column”: c2
“in”: Ascending order
param-repeat Insert Column selections
“3: Column Selections”
“Sort on column”: c3
“in”: Ascending order
We have already used this tool in a previous step with similar parameters.
You can redo all the input steps by step, or you can rerun the earlier sort tool:
Expand one of the output datasets of the tool (by clicking on it)
Click re-run galaxy-refresh the tool
This is useful if you want to run the tool again but with slightly different paramters, or if you just want to check which parameter setting you used.
That way, you can save some clicks. But make sure to select the output of Unique and set “Number of header lines to skip” to 0.
Comment: Details about the sorting
The configured numeric ascending sorts in this order:
Column 1: Year (Y)
Column 2: Month (M)
Column 3: Day (D).
This produces the final dataset which is a chronological list of eclipses that satisfy the magnitude threshold and belong to at least one qualifying group
Run the analysis as a workflow
Suppose you now want to repeat this analysis with different input data or parameter settings.
You would not want to repeat all these steps again by hand. For this, we can use the workflow.
The tutorial Extracting Workflows from Histories shows you how you can create a workflow from your own History. For variables to be flexible as in our workflow you need to extract your input parameters - how to achieve that is explained in the tutorial Using Workflow Parameters.
When you run the solar eclipse frequency workflow, you need to upload a file with the source data and to supply the following three values at runtime:
Workflow parameter
Example
Meaning
Minimum magnitude
0.8
Minimum observable magnitude (mag1)
Number of eclipses
3
Number of consecutive eclipses, N
Maximum interval in years
10
Maximum span between the first and Nth eclipse, X
But first, we must import the workflow into Galaxy:
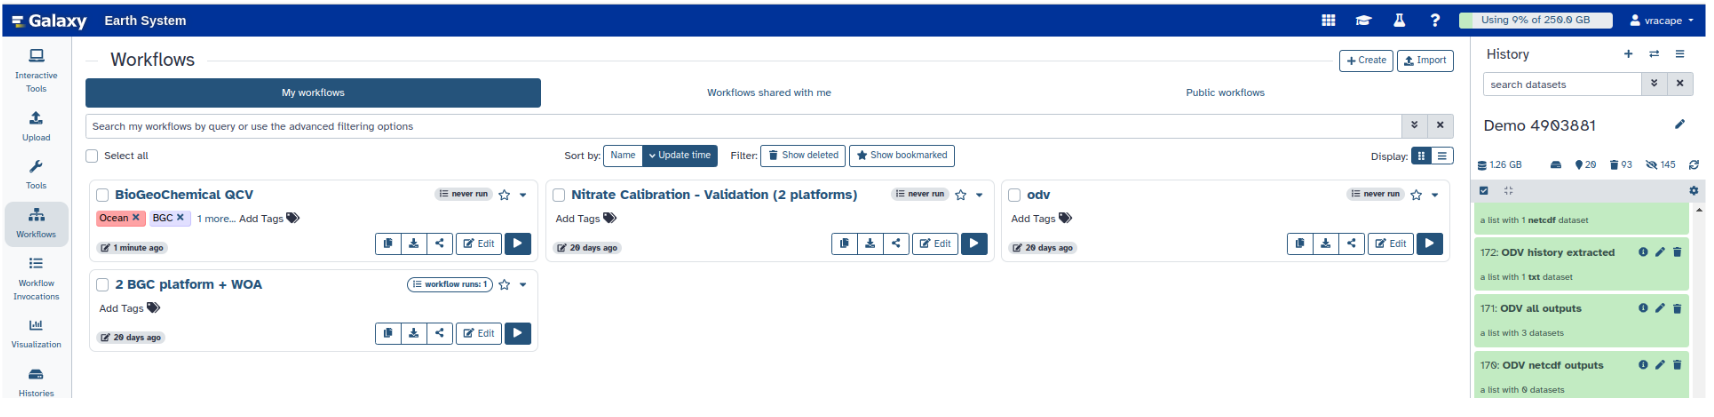
Click on galaxy-workflows-activityWorkflows in the Galaxy activity bar (on the left side of the screen, or in the top menu bar of older Galaxy instances). You will see a list of all your workflows
Click on galaxy-uploadImport at the top-right of the screen
Paste the following URL into the box labelled “Archived Workflow URL”: https://training.galaxyproject.org/training-material/topics/digital-humanities/tutorials/solar-eclipse-frequency/workflows/solar-eclipse-frequency.ga
Click the Import workflow button
Below is a short video demonstrating how to import a workflow from GitHub using this procedure:
Video: Importing a workflow from URL
Now we can run it:
Click on galaxy-workflows-activityWorkflows in the Galaxy activity bar (on the left side of the screen, or in the top menu bar of older Galaxy instances). You will see a list of all your workflows
Click on galaxy-uploadImport at the top-right of the screen
Provide your workflow
Option 1: Paste the URL of the workflow into the box labelled “Archived Workflow URL”
Option 2: Upload the workflow file in the box labelled “Archived Workflow File”
Click the Import workflow button
Below is a short video demonstrating how to import a workflow from GitHub using this procedure:
Video: Importing a workflow from URL
Hands On: Run the workflow
Run the workflow with the following parameters:
Select the eclipse data file as the workflow dataset input.
Enter 0.8 for Magnitude threshold.
Enter 3 for Number of eclipses.
Enter 10 for Maximum interval in years.
Run the workflow.
Click on galaxy-workflows-activityWorkflows on the Activity Bar on the left.
At the top of the resulting page you will have the option to switch between the My workflows, Workflows shared with me and Public workflows tabs.
Select the tab you want to see all workflows in that category
Search for your desired workflow.
Click on the workflow name: a pop-up window opens with a preview of the workflow.
To run it directly: click workflow-runRun (top-right). This will take you to the workflow run form.
Configure the workflow
Send results to a new history: if enabled, will send the results to a new history instead of your current active history. You can provide a name for the new history here as well.
Re-use jobs with identical parameters. This will check if any identical jobs have already been run before, and save compute time and energy by re-using the previous results. Great to use if you previously ran (part of) this workflow on the same data already.
Set the workflow parameters (e.g. input data)
Recommended: click Import (left of Run) to make your own local copy under Workflows / My Workflows.
Click on workflow-runRun Workflow in the upper right corner to start the workflow.
You will now see the workflow invocation page showing the progress of your workflow. This page can always be accessed via galaxy-panelviewWorkflow invocations on the Activity bar (left-hand menu).
If you sent the results to a new history, you can view this history by clicking on the galaxy-histories-activity history link in the top left corner of the workflow invocation page.
Interpreting the result
The workflow returns all eclipses with mag1 at or above the
threshold that are members of at least one group of N consecutive
qualifying eclipses occurring within the specified maximum interval.
The result should not be interpreted as evidence that historical
observers actually saw, recorded, or interpreted every eclipse. The
workflow identifies astronomical configurations in the pre-calculated
dataset; historical interpretation requires appropriate contextual
evidence.
Explore the parameters
The main advantage of the workflow is that the research question can be
changed without editing the workflow.
Hands On: Experiment
Run the workflow several times with different parameters.
For example, compare:
Minimum magnitude
N
Maximum interval
0.8
3
10
0.8
4
20
0.9
3
20
Consider:
How does raising the magnitude threshold affect the number of
qualifying eclipses?
How does increasing N change the result?
How sensitive are the results to the chosen time interval?
Are particular periods repeatedly selected under different
parameter combinations?
Why use a Galaxy workflow?
The workflow makes several parts of the analysis explicit:
the source dataset,
the transformations applied to the data,
the definition of observable magnitude used for filtering,
the chronological sorting,
the mathematical criterion used to define an eclipse group,
and the user-selected analytical parameters.
This makes the procedure easier to inspect, rerun, share, and modify
than an analysis in which these operations are performed manually.
Conclusion
You have built and run a parameterised Galaxy workflow for astronomical
chronology. Starting with a pre-calculated eclipse list, the workflow
converts and restructures the data, selects eclipses by observable
magnitude, identifies temporally concentrated groups, removes
overlapping duplicates, and produces a chronologically sorted result.
Because the three scientific criteria are runtime parameters, the same
workflow can be reused to investigate different hypotheses without
changing its internal structure.
You've Finished the Tutorial
Please also consider filling out the Feedback Form as well!
Key points
The observable magnitude mag1 is used for filtering.
The workflow exposes three runtime parameters: minimum magnitude, number of eclipses, and maximum interval in years.
Galaxy workflow parameters separate the scientific question from hard-coded values.
Perform compact, reproducible transformations and selections on tabular astronomical data.
The final result contains each qualifying eclipse once and is sorted chronologically.
Frequently Asked Questions
Have questions about this tutorial? Have a look at the available FAQ pages and support channels
Gautschy, R., 2012 Sonnenfinsternisse und ihre chronologische Bedeutung: Ein neuer Sonnenfinsterniskanon für Altertumswissenschaftler. Klio 94: 7–17. 10.1524/klio.2012.0001
Did you use this material as an instructor? Feel free to give us feedback on how it went.
Did you use this material as a learner or student? Click the form below to leave feedback.
Hiltemann, Saskia, Rasche, Helena et al., 2023 Galaxy Training: A Powerful Framework for Teaching! PLOS Computational Biology 10.1371/journal.pcbi.1010752
Batut et al., 2018 Community-Driven Data Analysis Training for Biology Cell Systems 10.1016/j.cels.2018.05.012
@misc{digital-humanities-solar-eclipse-frequency,
author = "Rita Gautschy",
	title = "Analysing Solar Eclipse Frequency with a Galaxy Workflow (Galaxy Training Materials)",
	year = "",
	month = "",
	day = "",
	url = "\url{https://training.galaxyproject.org/training-material/topics/digital-humanities/tutorials/solar-eclipse-frequency/tutorial.html}",
	note = "[Online; accessed TODAY]"
}
@article{Hiltemann_2023,
	doi = {10.1371/journal.pcbi.1010752},
	url = {https://doi.org/10.1371%2Fjournal.pcbi.1010752},
	year = 2023,
	month = {jan},
	publisher = {Public Library of Science ({PLoS})},
	volume = {19},
	number = {1},
	pages = {e1010752},
	author = {Saskia Hiltemann and Helena Rasche and Simon Gladman and Hans-Rudolf Hotz and Delphine Larivi{\`{e}}re and Daniel Blankenberg and Pratik D. Jagtap and Thomas Wollmann and Anthony Bretaudeau and Nadia Gou{\'{e}} and Timothy J. Griffin and Coline Royaux and Yvan Le Bras and Subina Mehta and Anna Syme and Frederik Coppens and Bert Droesbeke and Nicola Soranzo and Wendi Bacon and Fotis Psomopoulos and Crist{\'{o}}bal Gallardo-Alba and John Davis and Melanie Christine Föll and Matthias Fahrner and Maria A. Doyle and Beatriz Serrano-Solano and Anne Claire Fouilloux and Peter van Heusden and Wolfgang Maier and Dave Clements and Florian Heyl and Björn Grüning and B{\'{e}}r{\'{e}}nice Batut and},
	editor = {Francis Ouellette},
	title = {Galaxy Training: A powerful framework for teaching!},
	journal = {PLoS Comput Biol}
}
Funding
These individuals or organisations provided funding support for the development of this resource
 Rita Gautschy
 DaSCH
DaSCH
 Daniela Schneider
 Galaxy Switzerland
Questions:
 Open image in new tab