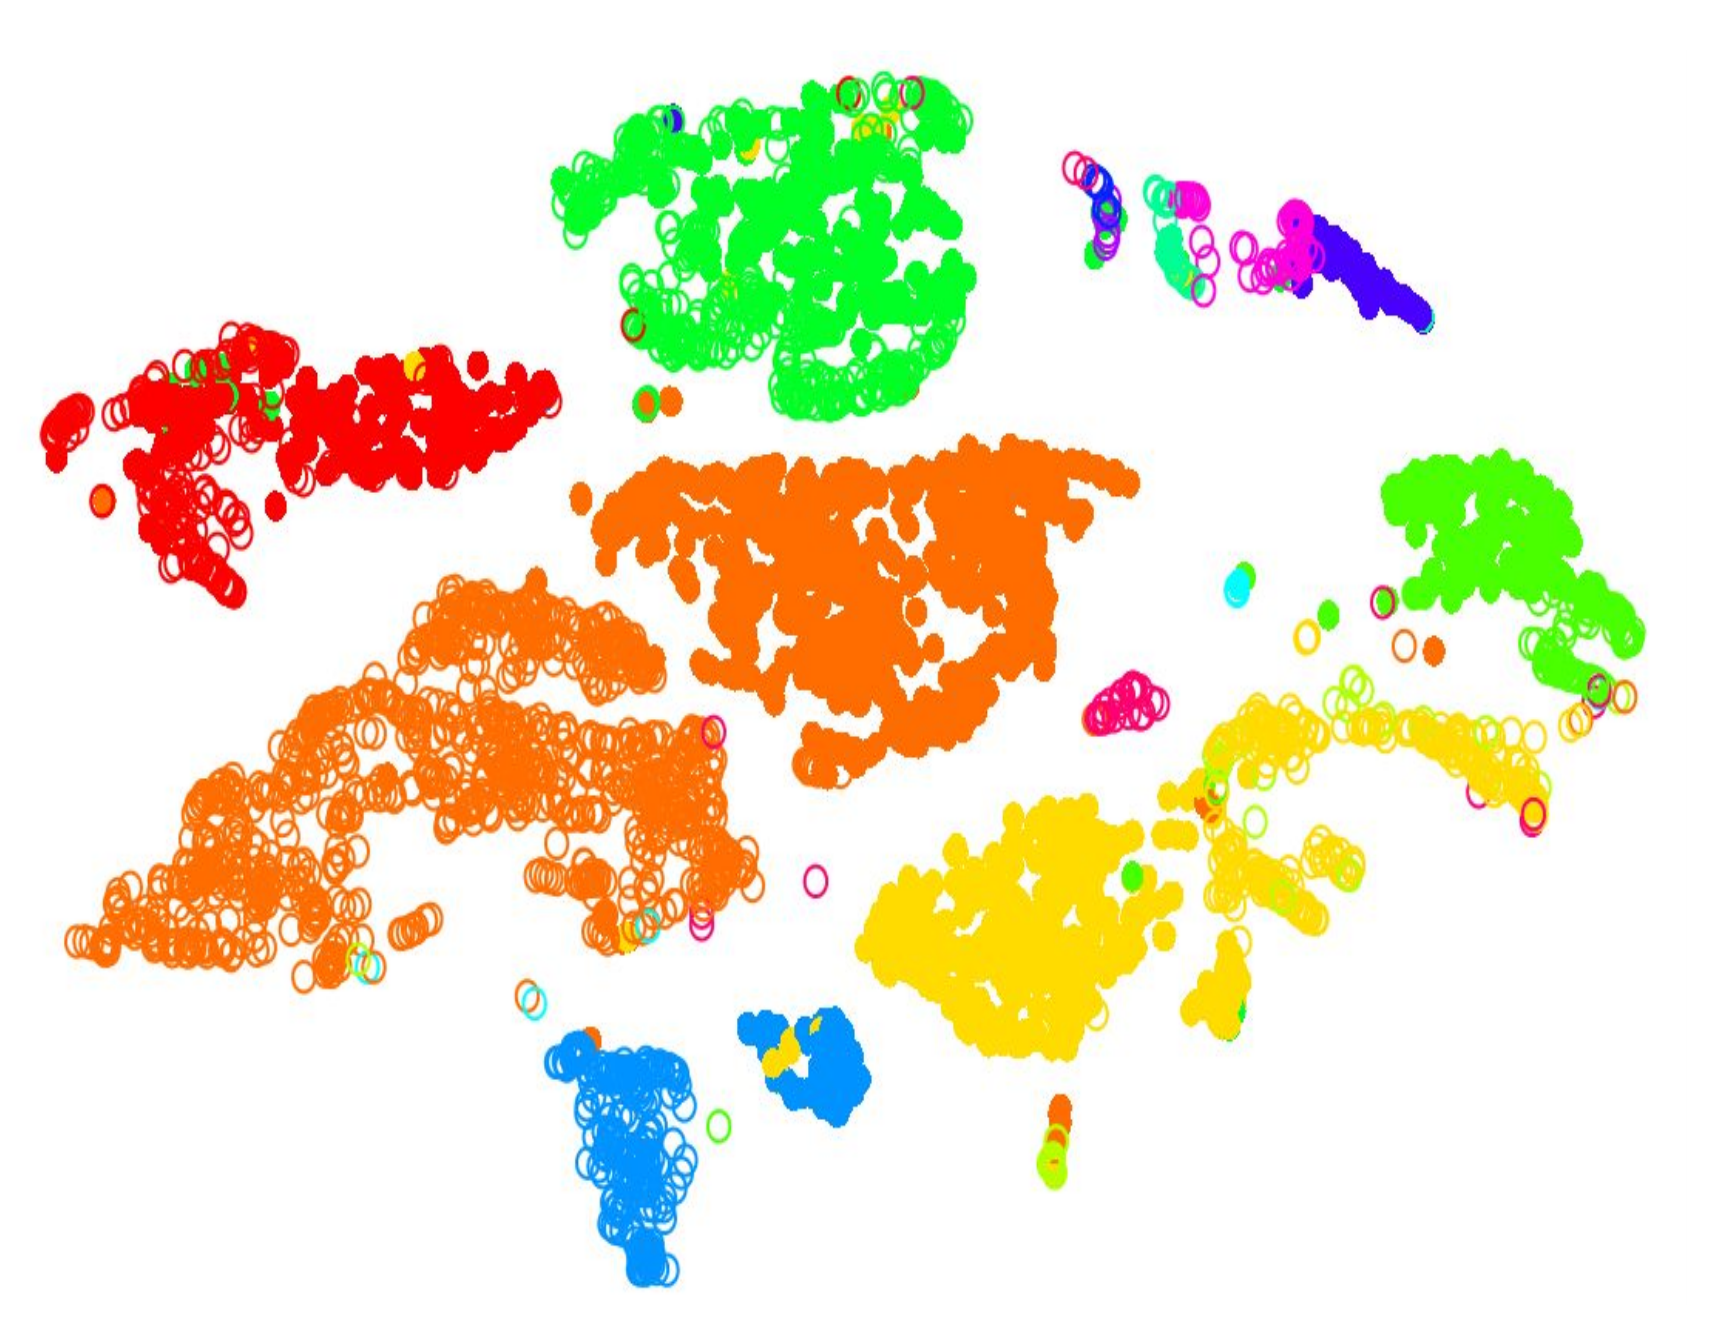
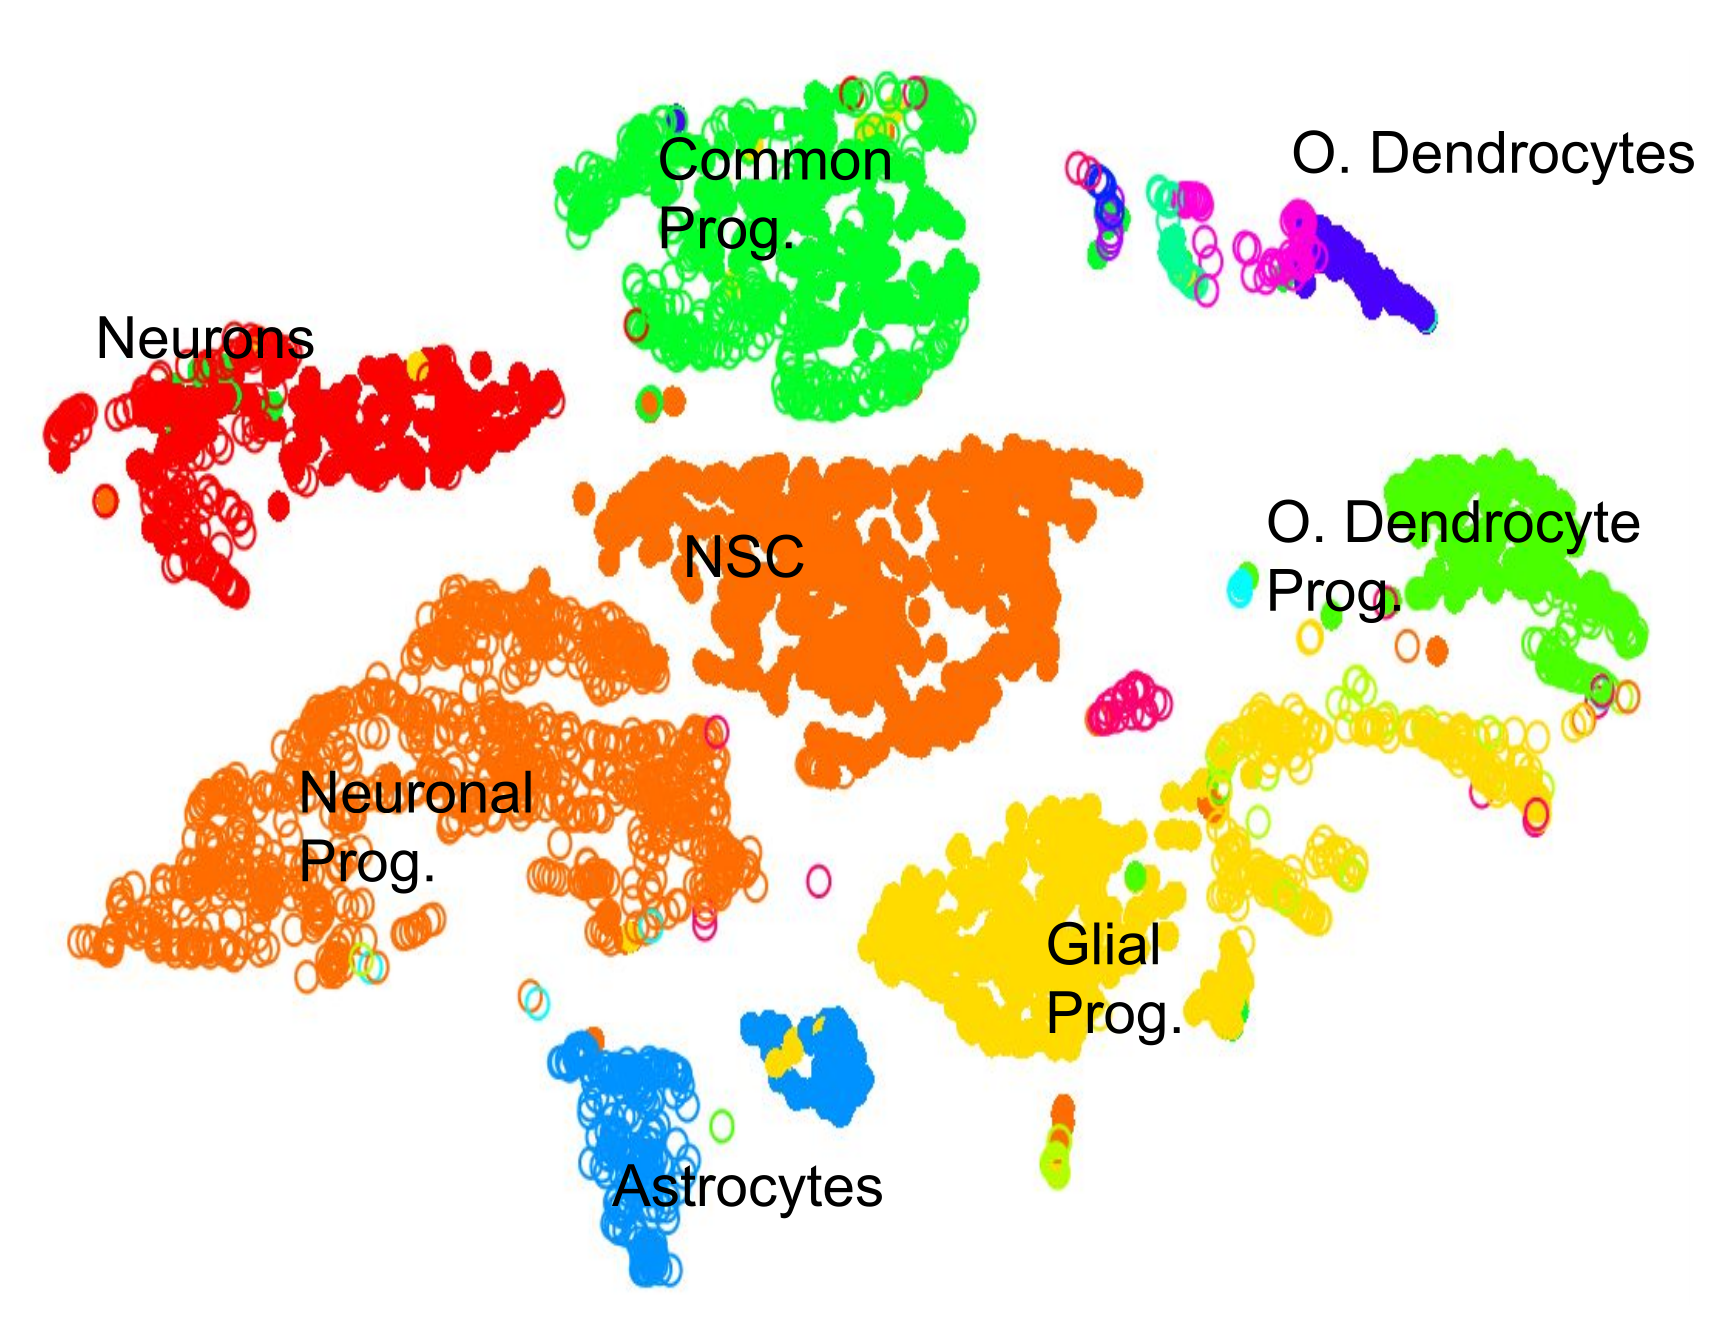
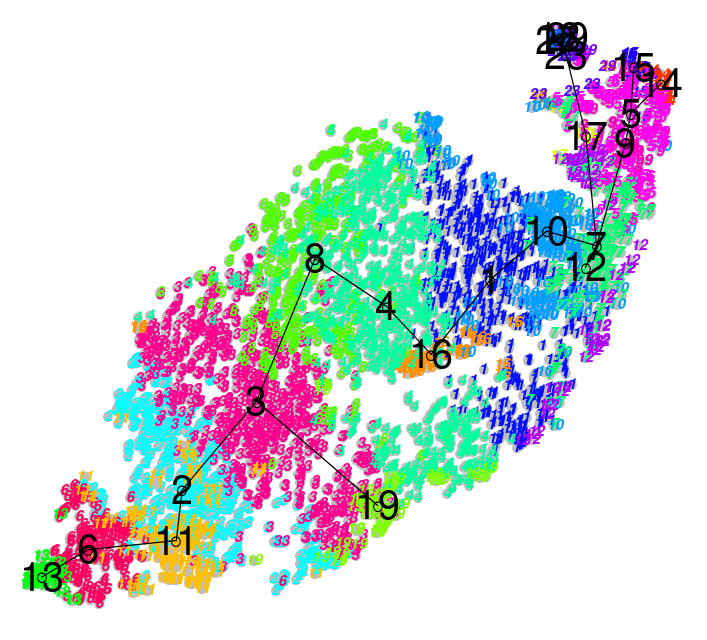
name: inverse layout: true class: center, middle, inverse <div class="my-header"><span> <a href="/training-material/topics/single-cell" title="Return to topic page" ><i class="fa fa-level-up" aria-hidden="true"></i></a> <a href="https://github.com/galaxyproject/training-material/edit/main/topics/single-cell/tutorials/scrna-scanpy-pbmc3k/slides.html"><i class="fa fa-pencil" aria-hidden="true"></i></a> </span></div> <div class="my-footer"><span> <img src="/training-material/assets/images/GTN-60px.png" alt="Galaxy Training Network" style="height: 40px;"/> </span></div> --- <img src="/training-material/assets/images/GTNLogo1000.png" alt="Galaxy Training Network" class="cover-logo"/> <br/> <br/> # Clustering 3K PBMCs with Scanpy <br/> <br/> <div markdown="0"> <div class="contributors-line"> <ul class="text-list"> <li> <a href="/training-material/hall-of-fame/mtekman/" class="contributor-badge contributor-mtekman"><img src="https://avatars.githubusercontent.com/mtekman?s=36" alt="Mehmet Tekman avatar" width="36" class="avatar" /> Mehmet Tekman</a></li> </ul> </div> </div> <!-- modified date --> <div class="footnote" style="bottom: 8em;"> <i class="far fa-calendar" aria-hidden="true"></i><span class="visually-hidden">last_modification</span> Updated: <i class="fas fa-fingerprint" aria-hidden="true"></i><span class="visually-hidden">purl</span><abbr title="Persistent URL">PURL</abbr>: <a href="https://gxy.io/GTN:S00087">gxy.io/GTN:S00087</a> </div> <!-- other slide formats (video and plain-text) --> <div class="footnote" style="bottom: 5em;"> <i class="fas fa-file-alt" aria-hidden="true"></i><span class="visually-hidden">text-document</span><a href="slides-plain.html"> Plain-text slides</a> | </div> <!-- usage tips --> <div class="footnote" style="bottom: 2em;"> <strong>Tip: </strong>press <kbd>P</kbd> to view the presenter notes | <i class="fa fa-arrows" aria-hidden="true"></i><span class="visually-hidden">arrow-keys</span> Use arrow keys to move between slides </div> ??? Presenter notes contain extra information which might be useful if you intend to use these slides for teaching. Press `P` again to switch presenter notes off Press `C` to create a new window where the same presentation will be displayed. This window is linked to the main window. Changing slides on one will cause the slide to change on the other. Useful when presenting. --- ## Requirements Before diving into this slide deck, we recommend you to have a look at: - [Introduction to Galaxy Analyses](/training-material/topics/introduction) --- ### <i class="far fa-question-circle" aria-hidden="true"></i><span class="visually-hidden">question</span> Questions - What are the main steps of scRNA-seq? - What kind of variation can confound an analysis? --- ### <i class="fas fa-bullseye" aria-hidden="true"></i><span class="visually-hidden">objectives</span> Objectives - Learn the main stages of an scRNA-seq analysis - Understand the methods and concepts underlying scRNA-seq --- ### Single Cell RNA Pre-processing  ??? 1. Barcode Extraction 1. Mapping 1. Gene Annotation 1. Batch count matrices --- ### Single Cell RNA Downstream Analysis  ??? 1. Filtering 1. Normalising * Confounder Removal 1. Dimension Reduction 1. Clustering * Annotation --- ### Barcoding Cells  --- ### Filtering: Cell and Gene  --- ### Normalisation: Technical Variation  --- ### Normalisation: Biological Variation  --- ### Dimension Reduction: Relatedness of Cells  ??? Build a KNN graph from distance matrix: * If P and q share distance which is --- ### Dimension Reduction: Projection  ??? - Can use tSNE, PCA, UMAP --- ### Community Clustering: Louvain Aim: Maximise internal links and minimise external links  --- ### Community Clustering: Louvain Pick a cell, place in neighbour, and accept if *internal:external* increases  --- ### Cell Type: Identifying Cluster Types .left-column50[.image-100[]] .left-column50[.image-100[]] --- ### Clustering: Hard vs Soft .pull-left[ <br /> .image-100[] *Hard* * Big spaces between clusters * Cell types are well defined and the clustering reflects that ] -- .pull-right[ .image-100[] *Soft* * Clusters bleed into one another * Cell types seem to intermingle with one another. ] ??? Why? Why would there be clusters so close to one another? --- ### Continuous Phenotypes: .image-100[] ??? * Cells aren't discrete, they transition * Continuously changing over time from a less mature type to more mature type --- ### Interactive Environments: live.usegalaxy.eu <br/> <video style="width:100%;height:auto;" controls> <source src="https://zenodo.org/record/3687100/files/live_cellxgene.mp4" /> </video> ??? What is Differential Expression in scRNA-seq? --- ### CellxGene Local Test * We can probe clusters to see how they are so differentially expressed pip3 install cellxgene cellxgene launch https://cellxgene-example-data.czi.technology/pbmc3k.h5ad * Launch locally: http://127.0.0.1:5005 --- ### <i class="fas fa-key" aria-hidden="true"></i><span class="visually-hidden">keypoints</span> Key points - Understanding the purpose of barcoding - Knowing the difference between hard and soft clustering - A KNN graph can be generated from a count matrix. - Community clustering can be generated from a KNN graph. - Interpreting scRNA-seq plots --- ## Thank You! This material is the result of a collaborative work. Thanks to the [Galaxy Training Network](https://training.galaxyproject.org) and all the contributors! <div markdown="0"> <div class="contributors-line"> <table class="contributions"> <tr> <td><abbr title="These people wrote the bulk of the tutorial, they may have done the analysis, built the workflow, and wrote the text themselves.">Author(s)</abbr></td> <td> <a href="/training-material/hall-of-fame/mtekman/" class="contributor-badge contributor-mtekman"><img src="https://avatars.githubusercontent.com/mtekman?s=36" alt="Mehmet Tekman avatar" width="36" class="avatar" /> Mehmet Tekman</a> </td> </tr> <tr class="reviewers"> <td><abbr title="These people reviewed this material for accuracy and correctness">Reviewers</abbr></td> <td> <a href="/training-material/hall-of-fame/bgruening/" class="contributor-badge contributor-badge-small contributor-bgruening"><img src="https://avatars.githubusercontent.com/bgruening?s=36" alt="Björn Grüning avatar" width="36" class="avatar" /></a><a href="/training-material/hall-of-fame/mtekman/" class="contributor-badge contributor-badge-small contributor-mtekman"><img src="https://avatars.githubusercontent.com/mtekman?s=36" alt="Mehmet Tekman avatar" width="36" class="avatar" /></a><a href="/training-material/hall-of-fame/hexylena/" class="contributor-badge contributor-badge-small contributor-hexylena"><img src="https://avatars.githubusercontent.com/hexylena?s=36" alt="Helena Rasche avatar" width="36" class="avatar" /></a></td> </tr> </table> </div> </div> <div style="display: flex;flex-direction: row;align-items: center;justify-content: center;"> <img src="/training-material/assets/images/GTNLogo1000.png" alt="Galaxy Training Network" style="height: 100px;"/> </div> Tutorial Content is licensed under <a rel="license" href="http://creativecommons.org/licenses/by/4.0/">Creative Commons Attribution 4.0 International License</a>.<br/>