| Author(s) |
|
Posted on: 18 August 2025 purlPURL: https://gxy.io/GTN:N00118
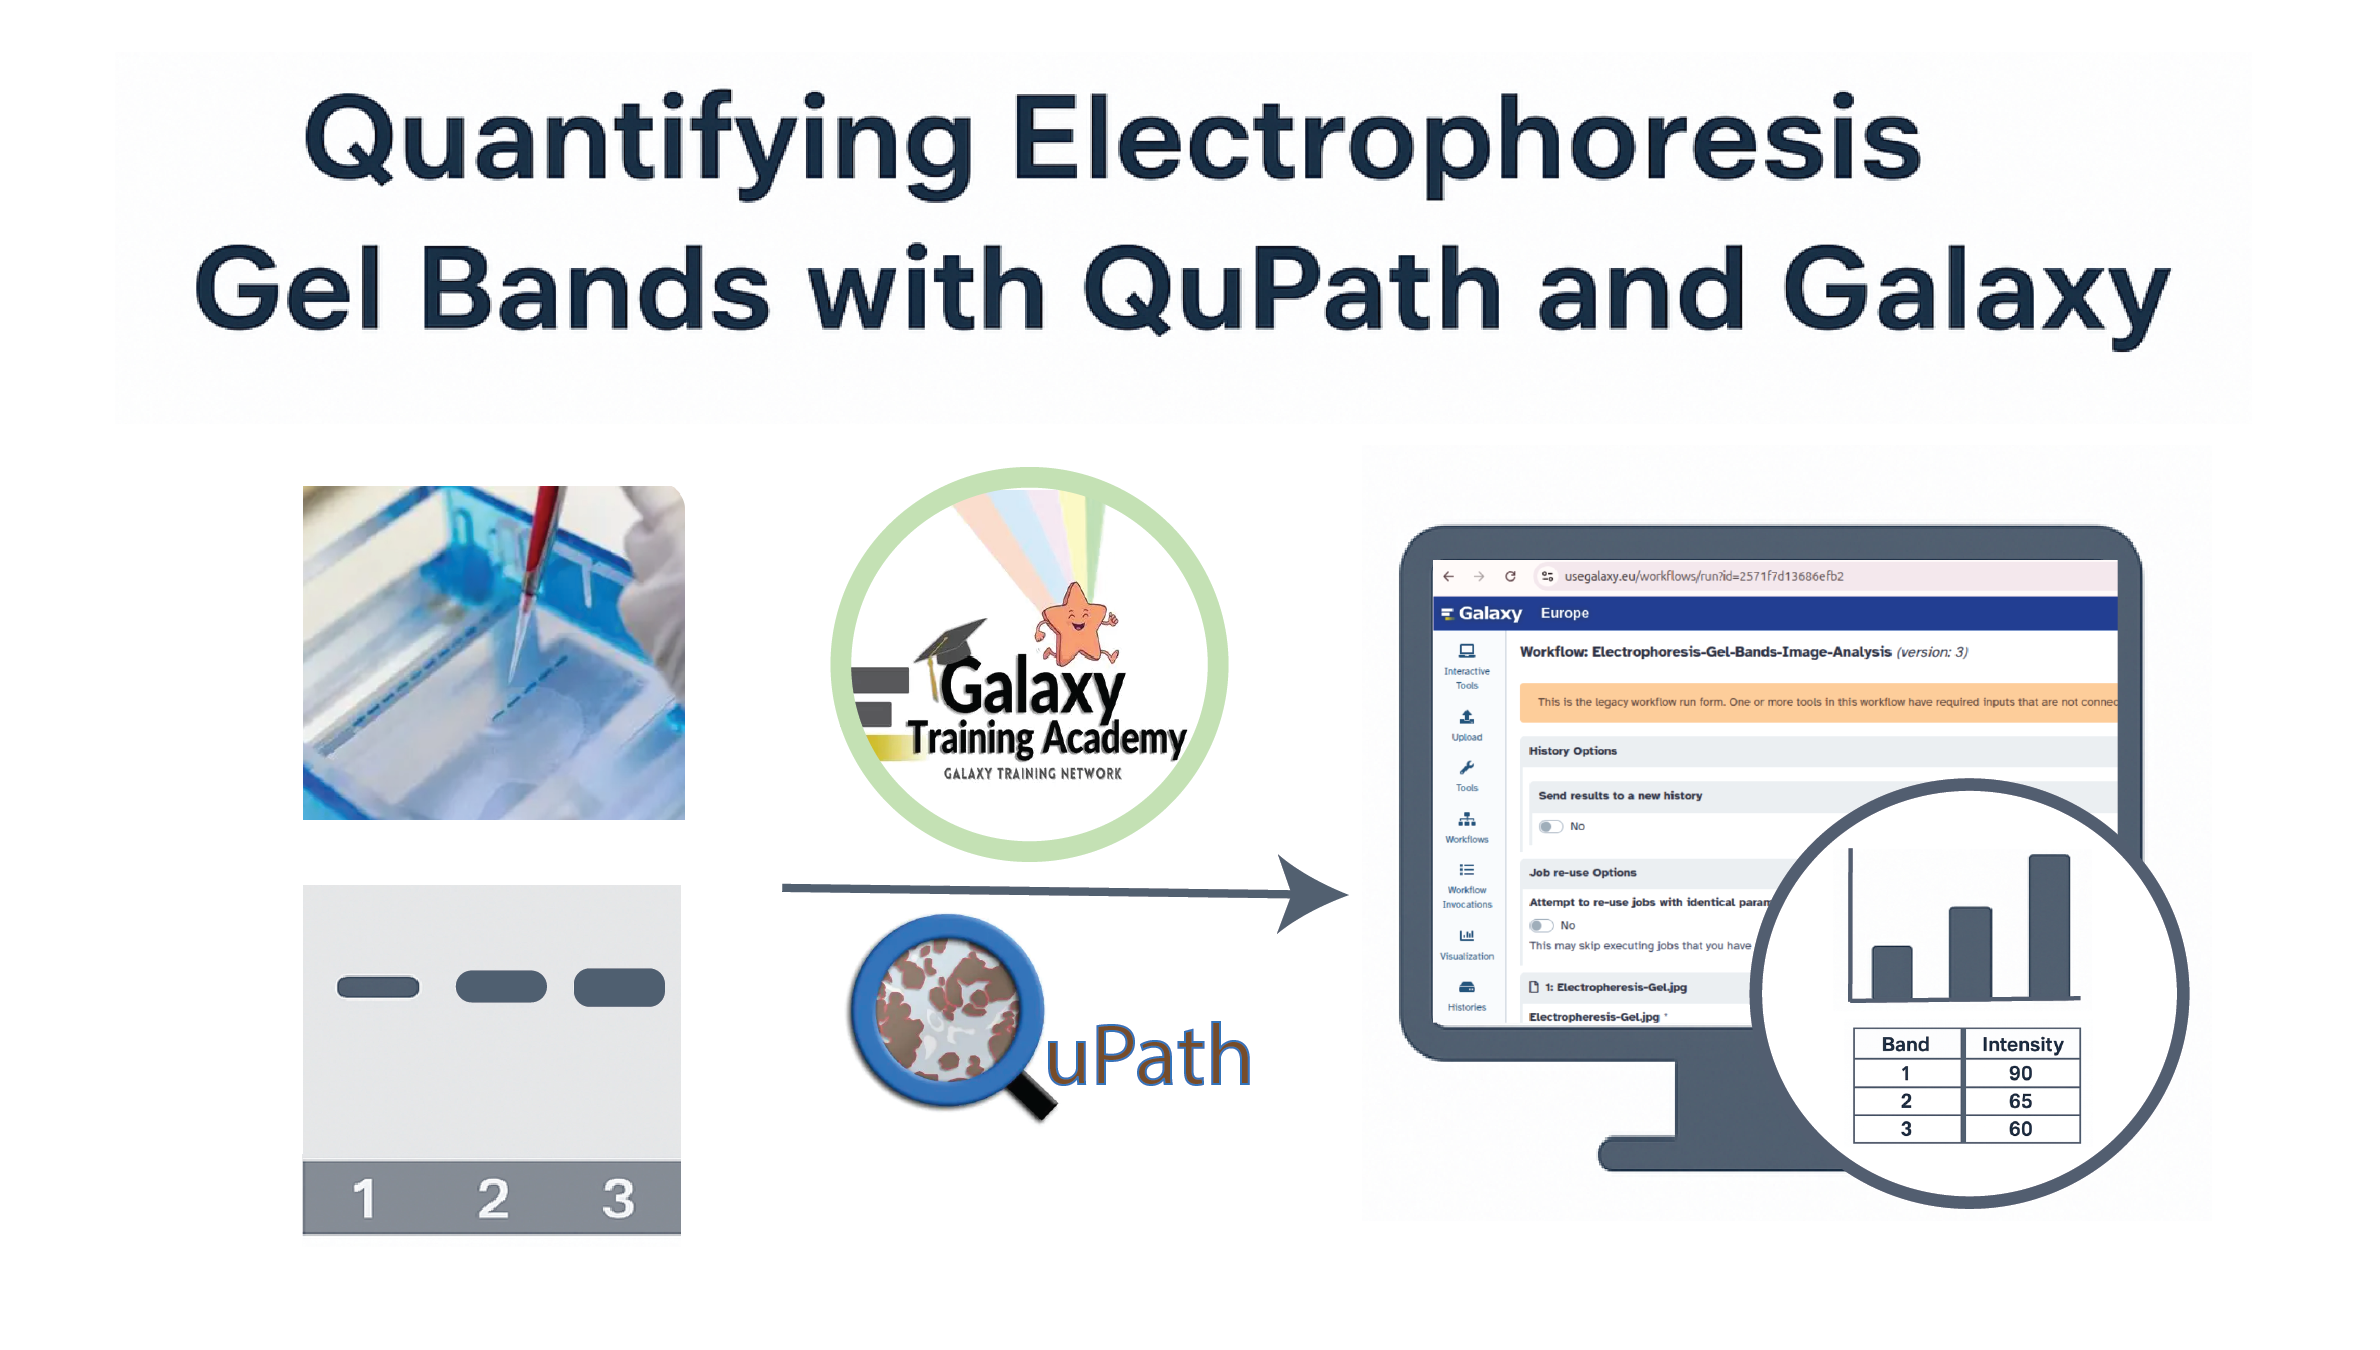
Gel Electrophoresis is a staple of molecular biology, providing a way to separate DNA, RNA, or proteins by size and charge. While gels are usually interpreted visually, the ability to quantify band intensities offers much richer insights—allowing researchers to estimate product yields, verify PCR amplification, or assess protein purity.
Band quantification can be carried out using interactive tools such as QuPath that allow researchers to define regions of interest (ROIs) directly on gel images. These ROIs can be exported as GeoJSON files, which capture the spatial coordinates of the selected bands in a standardized, machine-readable format compatible with other tools. To address this, we’ve developed a new hands-on Galaxy tutorial that shows how to combine QuPath and Galaxy imaging tools for a transparent, reproducible workflow for gel band analysis.
Why This Matters
Open-source workflows make gel quantification more accessible and reliable. They run in a web browser without extra software or powerful hardware. Each step is recorded, ensuring reproducibility, and results can be shared or adapted with ease. With this new workflow:
- QuPath is used to interactively select gel bands as regions of interest (ROIs) and export them as GeoJSON files.
- Galaxy processes these ROI files to create label maps, extract intensity values, and generate tabular results for downstream analysis.
This approach reduces bias, makes results reproducible, and integrates seamlessly with other Galaxy-based analyses.
How the Workflow Works
The tutorial walks learners through each step:
- Image preparation – Uploading gel images into Galaxy, converting them to TIFF format, and splitting channels for analysis.
- Annotation with QuPath – Drawing rectangles around gel bands, assigning labels, and exporting the results as GeoJSON files.
- ROI processing in Galaxy – Converting the coordinates into label maps and extracting pixel intensities.
- Quantification and output – Generating tabular outputs with mean intensity values for each band.
The workflow is fully documented with screenshots, tool links, and downloadable datasets, making it accessible for both beginners and advanced users.
Smooth, Reproducible Analysis
One of the key advantages of this tutorial is how it bridges the gap between interactive annotation (via QuPath) and automated quantification (via Galaxy). Learners don’t need specialized software installations—everything runs in the browser—and the results can be reproduced or extended in new analyses.
By following the steps, users gain experience with:
- Using QuPath for image annotation
- Generating and handling ROI files
- Leveraging Galaxy imaging tools for reproducible quantification
Open Tools, Open Training
As with all Galaxy Training Network (GTN) tutorials, this workflow is fully open-source and freely available. It supports the GTN’s mission to provide transparent, accessible, and reusable training resources in bioinformatics and bioimaging.
We invite educators, researchers, and learners to try the tutorial, adapt it to their datasets, and integrate it into teaching or research pipelines.
👉 Explore the tutorial here: Quantification of electrophoresis gel bands using QuPath and Galaxy imaging tools