This tutorial is designed to guide you through the annotation of audio data via the NEAL interactive tool.
NEAL (Nature+Energy Audio Labeller) A et al. 2023 is an open-source interactive audio data annotation tool. Built using R and the associated R Shiny framework, the tool provides a reactive environment where users can quickly annotate audio files and adjust settings which automatically change the corresponding elements of the user interface. The app has been designed with the goal of having both expert birders and citizen scientists contribute to acoustic annotation projects GIBBONS.
The data we will work with in this tutorial is a 0:43min recording of a common blackbird (Turdus merula) recorded in Armenia above Alaverdi town. For more information, you can see metadata on the xeno-canto site.
In this tutorial, you will learn how to import an audio file into Galaxy, run the NEAL interactive tool, annotate the spectrogram, and export the resulting annotation file.
So, the first step is to your audio file into Galaxy.
In this tutorial, we will use the recording mentioned earlier, but feel free to use your own file(s). The NEAL interactive tool allows working on multiple files, so you can upload the number of files you want.
Hands On: Data Upload
Create a new history for this tutorial and give it a name, e.g., “NEAL tutorial” for you to find it again later if needed.
To create a new history simply click the new-history icon at the top of the history panel:
Click on galaxy-pencil (Edit) next to the history name (which by default is “Unnamed history”)
Type the new name
Click on Save
To cancel renaming, click the galaxy-undo “Cancel” button
If you do not have the galaxy-pencil (Edit) next to the history name (which can be the case if you are using an older version of Galaxy) do the following:
Click on Unnamed history (or the current name of the history) (Click to rename history) at the top of your history panel
Type the new name
Press Enter
Import the example audio file from xeno-canto
Audio file :
https://xeno-canto.org/1008421/download
Copy the link location
Click galaxy-uploadUpload at the top of the activity panel
Select galaxy-wf-editPaste/Fetch Data
Paste the link(s) into the text field
Press Start
Close the window
As an alternative to uploading the data from a URL or your computer, the files may also have been made available from a Choose from repositories:
Click on Upload Data on the top of the left panel
Click on Choose from repository and scroll down to find your repository or type the repository name in the search box on the top.
Select the datasets you want to import
click on OK
Click on Start
Click on Close
You can find the dataset has begun loading in you history.
Rename the dataset (default name: Download) to something more explicit, e.g., 1008421.wav to have a name linked to the xeno-canto identifier.
Click on the galaxy-pencilpencil icon for the dataset to edit its attributes
In the central panel, change the Name field
Click the Save button
Note that you also can provide the 1008421.wav filename on the “Paste/Fetch data” upload module to avoid renaming after importing the file.
Make sure the dataset’s datatype is .wav, as the tool only supports this format.
Click on the galaxy-pencilpencil icon for the dataset to edit its attributes
In the central panel, click galaxy-chart-select-dataDatatypes tab on the top
In the galaxy-chart-select-dataAssign Datatype, select your desired datatype from “New Type” dropdown
Tip: you can start typing the datatype into the field to filter the dropdown menu
Click the Save button
You can add a tag to your dataset if you need to distinguish multiple datasets in your history.
Datasets can be tagged. This simplifies the tracking of datasets across the Galaxy interface. Tags can contain any combination of letters or numbers but cannot contain spaces.
To tag a dataset:
Click on the dataset to expand it
Click on Add Tagsgalaxy-tags
Add tag text. Tags starting with # will be automatically propagated to the outputs of tools using this dataset (see below).
Press Enter
Check that the tag appears below the dataset name
Tags beginning with # are special!
They are called Name tags. The unique feature of these tags is that they propagate: if a dataset is labelled with a name tag, all derivatives (children) of this dataset will automatically inherit this tag (see below). The figure below explains why this is so useful. Consider the following analysis (numbers in parenthesis correspond to dataset numbers in the figure below):
a set of forward and reverse reads (datasets 1 and 2) is mapped against a reference using Bowtie2 generating dataset 3;
dataset 3 is used to calculate read coverage using BedTools Genome Coverageseparately for + and - strands. This generates two datasets (4 and 5 for plus and minus, respectively);
datasets 4 and 5 are used as inputs to Macs2 broadCall datasets generating datasets 6 and 8;
datasets 6 and 8 are intersected with coordinates of genes (dataset 9) using BedTools Intersect generating datasets 10 and 11.
Now consider that this analysis is done without name tags. This is shown on the left side of the figure. It is hard to trace which datasets contain “plus” data versus “minus” data. For example, does dataset 10 contain “plus” data or “minus” data? Probably “minus” but are you sure? In the case of a small history like the one shown here, it is possible to trace this manually but as the size of a history grows it will become very challenging.
The right side of the figure shows exactly the same analysis, but using name tags. When the analysis was conducted datasets 4 and 5 were tagged with #plus and #minus, respectively. When they were used as inputs to Macs2 resulting datasets 6 and 8 automatically inherited them and so on… As a result it is straightforward to trace both branches (plus and minus) of this analysis.
Use the play button below the sonogram to listen to the audio recording.
You can pause, stop, or replay as needed. And, adjust playback speed if necessary.
Warning
As you can see, regardless of the total duration of your file, NEAL lets you listen to the audio in 15-second segments.
Annotate the audio file
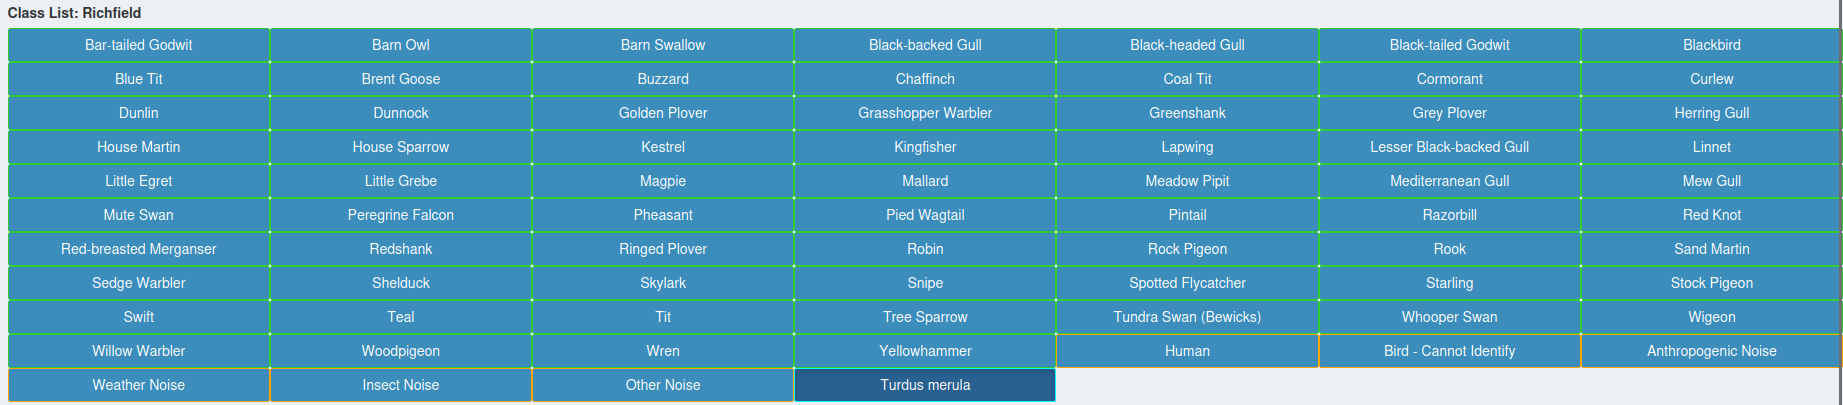
Add a label
If this is your first annotation, you will need to create a label (e.g. “Blackbird song”, “Noise”, etc.).
Hands On: Add a label
Type the label name (e.g. Turdus merula).
Click the Add button in the Category buttons section.
Don’t worry if the NEAL tool appears in red in your history after shutting it down.
This is due to how Galaxy handles the termination of interactive tools and won’t impact your work.
Rerun NEAL interactive tool with a previous labels file
If you need to continue your work on this audio file later you can restart the NEAL interactive tool using the CSV file containing your previous labels.
Hands On: Rerun NEAL interactive tool
NEAL with the following parameters:
param-file“Input sound data file(s) in wav format”: 1008421.wav
param-file“Do you already have a labels file?”: Load a previous labels file
param-file“Input sound data labels file in csv format”: my_labels_file.csv
You can now continue your work from where you left off.
Warning
Using it into Galaxy, NEAL does not automatically save labels in its Class List.
Labels are stored only inside the sonogram annotations.
This means you may need to recreate/re-add labels before adding new annotations.
Conclusion
👏 Congratulations! You have completed the NEAL tutorial.
You have learned how to:
Import audio data into Galaxy
Launch and use the NEAL interactive tool
Annotate audio files
Export and re-use annotation files
If you have questions or encounter issues, please check the documentation or contact the Galaxy community for support.
You've Finished the Tutorial
Please also consider filling out the Feedback Form as well!
Key points
Get audio data from an external source
Start, use and stop an interactive tool
Annotate audio files
Frequently Asked Questions
Have questions about this tutorial? Have a look at the available FAQ pages and support channels
Further information, including links to documentation and original publications, regarding the tools, analysis techniques and the interpretation of results described in this tutorial can be found here.
References
A, G., D. I, G. C, K. E, and P. A, 2023 NEAL: an open-source tool for audio annotation. PeerJ. 10.7717/peerj.15913
GIBBONS, A. N. T. H. O. N. Y. T. H. O. M. A. S. NEAL (Nature+Energy Audio Labeller) R Shiny app. https://github.com/gibbona1/neal
Feedback
Did you use this material as an instructor? Feel free to give us feedback on how it went.
Did you use this material as a learner or student? Click the form below to leave feedback.
Hiltemann, Saskia, Rasche, Helena et al., 2023 Galaxy Training: A Powerful Framework for Teaching! PLOS Computational Biology 10.1371/journal.pcbi.1010752
Batut et al., 2018 Community-Driven Data Analysis Training for Biology Cell Systems 10.1016/j.cels.2018.05.012
@misc{ecology-NEAL_tutorial,
author = "Pauline Seguineau and Haswane Chei and Yvan Le Bras",
	title = "Audio data annotation with NEAL (Nature + Energy Audio labeler) (Galaxy Training Materials)",
	year = "",
	month = "",
	day = "",
	url = "\url{https://training.galaxyproject.org/training-material/topics/ecology/tutorials/NEAL_tutorial/tutorial.html}",
	note = "[Online; accessed TODAY]"
}
@article{Hiltemann_2023,
	doi = {10.1371/journal.pcbi.1010752},
	url = {https://doi.org/10.1371%2Fjournal.pcbi.1010752},
	year = 2023,
	month = {jan},
	publisher = {Public Library of Science ({PLoS})},
	volume = {19},
	number = {1},
	pages = {e1010752},
	author = {Saskia Hiltemann and Helena Rasche and Simon Gladman and Hans-Rudolf Hotz and Delphine Larivi{\`{e}}re and Daniel Blankenberg and Pratik D. Jagtap and Thomas Wollmann and Anthony Bretaudeau and Nadia Gou{\'{e}} and Timothy J. Griffin and Coline Royaux and Yvan Le Bras and Subina Mehta and Anna Syme and Frederik Coppens and Bert Droesbeke and Nicola Soranzo and Wendi Bacon and Fotis Psomopoulos and Crist{\'{o}}bal Gallardo-Alba and John Davis and Melanie Christine Föll and Matthias Fahrner and Maria A. Doyle and Beatriz Serrano-Solano and Anne Claire Fouilloux and Peter van Heusden and Wolfgang Maier and Dave Clements and Florian Heyl and Björn Grüning and B{\'{e}}r{\'{e}}nice Batut and},
	editor = {Francis Ouellette},
	title = {Galaxy Training: A powerful framework for teaching!},
	journal = {PLoS Comput Biol}
}
Funding
These individuals or organisations provided funding support for the development of this resource
Questions:


Open image in new tab
Open image in new tab
Open image in new tab
Open image in new tab
Open image in new tab
Open image in new tab
Open image in new tab
 Open image in new tab
Open image in new tab
Open image in new tab
Open image in new tab
Open image in new tab
Open image in new tab
Open image in new tab