The next step of the clinical metaproteomics workflow is the quantification workflow. Running a quantification workflow in proteomics is essential for several critical purposes. It allows researchers to measure and compare the abundance of proteins or peptides in biological samples, offering valuable insights into biomarker discovery, comparative analysis, and differential expression studies. Quantitative proteomics helps reveal the functional roles of proteins, the stoichiometry of protein complexes, and the effects of drugs on protein expression in pharmacological studies. Additionally, it serves as a quality control measure, validating initial protein identifications, and providing data normalization for increased accuracy. Quantitative data are indispensable for hypothesis testing, systems biology, and their clinical relevance in areas such as disease diagnosis, prognosis, and therapeutic decision-making. In summary, the quantitation workflow in proteomics is a cornerstone for deciphering the complexities of protein expression and regulation, facilitating a wide array of biological and clinical applications.
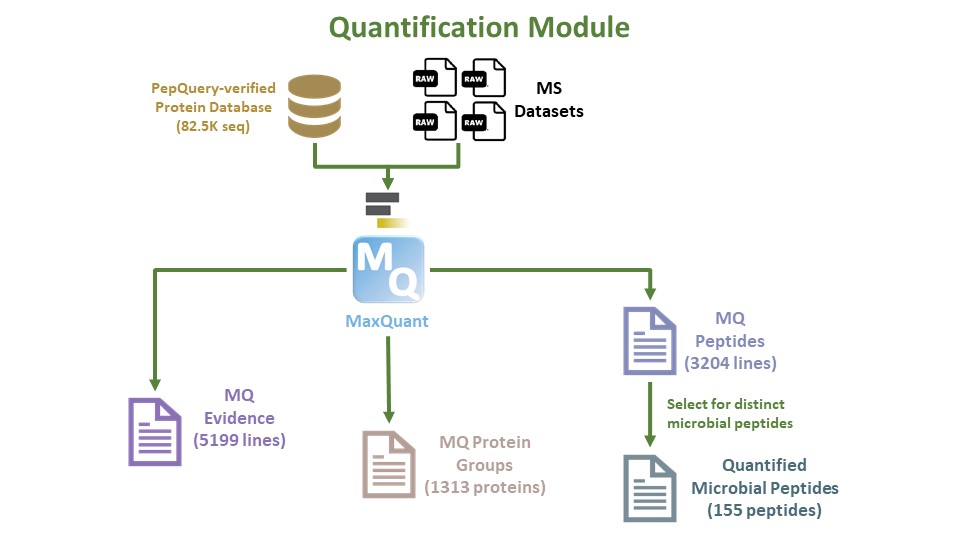
In this current workflow, we perform Quantification using the MaxQuant tool and the output will be interpreted in our next module.
Click galaxy-uploadUpload at the top of the activity panel
Select galaxy-wf-editPaste/Fetch Data
Paste the link(s) into the text field
Press Start
Close the window
As an alternative to uploading the data from a URL or your computer, the files may also have been made available from a shared data library:
Go into Libraries (left panel)
Navigate to the correct folder as indicated by your instructor.
On most Galaxies tutorial data will be provided in a folder named GTN - Material –> Topic Name -> Tutorial Name.
Select the desired files
Click on Add to Historygalaxy-dropdown near the top and select as Datasets from the dropdown menu
In the pop-up window, choose
“Select history”: the history you want to import the data to (or create a new one)
Click on Import
Rename the datasets
Check that the datatype
Click on the galaxy-pencilpencil icon for the dataset to edit its attributes
In the central panel, click galaxy-chart-select-dataDatatypes tab on the top
In the galaxy-chart-select-dataAssign Datatype, select datatypes from “New Type” dropdown
Tip: you can start typing the datatype into the field to filter the dropdown menu
Click the Save button
Add to each database a tag corresponding to input files.
Create a dataset of the RAW files.
Datasets can be tagged. This simplifies the tracking of datasets across the Galaxy interface. Tags can contain any combination of letters or numbers but cannot contain spaces.
To tag a dataset:
Click on the dataset to expand it
Click on Add Tagsgalaxy-tags
Add tag text. Tags starting with # will be automatically propagated to the outputs of tools using this dataset (see below).
Press Enter
Check that the tag appears below the dataset name
Tags beginning with # are special!
They are called Name tags. The unique feature of these tags is that they propagate: if a dataset is labelled with a name tag, all derivatives (children) of this dataset will automatically inherit this tag (see below). The figure below explains why this is so useful. Consider the following analysis (numbers in parenthesis correspond to dataset numbers in the figure below):
a set of forward and reverse reads (datasets 1 and 2) is mapped against a reference using Bowtie2 generating dataset 3;
dataset 3 is used to calculate read coverage using BedTools Genome Coverageseparately for + and - strands. This generates two datasets (4 and 5 for plus and minus, respectively);
datasets 4 and 5 are used as inputs to Macs2 broadCall datasets generating datasets 6 and 8;
datasets 6 and 8 are intersected with coordinates of genes (dataset 9) using BedTools Intersect generating datasets 10 and 11.
Now consider that this analysis is done without name tags. This is shown on the left side of the figure. It is hard to trace which datasets contain “plus” data versus “minus” data. For example, does dataset 10 contain “plus” data or “minus” data? Probably “minus” but are you sure? In the case of a small history like the one shown here, it is possible to trace this manually but as the size of a history grows it will become very challenging.
The right side of the figure shows exactly the same analysis, but using name tags. When the analysis was conducted datasets 4 and 5 were tagged with #plus and #minus, respectively. When they were used as inputs to Macs2 resulting datasets 6 and 8 automatically inherited them and so on… As a result it is straightforward to trace both branches (plus and minus) of this analysis.
Click on galaxy-workflows-activityWorkflows in the Galaxy activity bar (on the left side of the screen, or in the top menu bar of older Galaxy instances). You will see a list of all your workflows
Click on galaxy-uploadImport at the top-right of the screen
Paste the following URL into the box labelled “Archived Workflow URL”: https://training.galaxyproject.org/training-material/topics/proteomics/tutorials/clinical-mp-4-quantitation/workflows/WF4_Quantitation_Workflow.ga
Click the Import workflow button
Below is a short video demonstrating how to import a workflow from GitHub using this procedure:
Video: Importing a workflow from URL
Run Workflowworkflow using the following parameters:
The outputs we are most interested in consist of the MaxQuant Evidence file, MaxQuant Protein Groups, and MaxQuant Peptides. The MaxQuant Peptides file will allow us to group them to generate a list of quantified microbial peptides.
Hands On: Quantify verified peptides (from PepQuery2)
MaxQuant ( Galaxy version 1.6.17.0+galaxy4) with the following parameters:
In “Input Options”:
param-file“FASTA files”: Quantitation Database for MaxQuant (Input dataset)
In “Search Options”:
param-file“Specify an experimental design template (if needed). For detailed instructions see the help text.”: output (Input dataset)
“minimum peptide length”: 8
“Match between runs”: Yes
“Maximum peptide length for unspecific searches”: 50
In “Protein quantification”:
“Use only unmodified peptides”: Yes
“Modifications used in protein quantification”: Oxidation (M)
In “LFQ Options”:
“iBAQ (calculates absolute protein abundances by normalizing to copy number and not protein mass)”: No
“Select the desired outputs.”: Protein Groupsmqpar.xmlPeptidesEvidenceMSMS
Question
Why can we switch back to using RAW files for MaxQuant, instead of using MGF files?
MaxQuant prefers RAW format compared to MGF as it has more information compared to MGF.
Question
Previously, we used MaxQuant in the Discovery workflow. Why are we using MaxQuant again, instead of Search GUI/PeptideShaker?
We are using MaxQuant for quantification purposes only. SearchGUI Peptide Shaker doesn’t have the capability to perform quantification of peptides or proteins.
Using Text Manipulation Tools to Manage MaxQuant Outputs
Hands On: Select microbial protein groups from MaxQuant with Select
Select with the following parameters:
param-file“Select lines from”: proteinGroups (output of MaxQuanttool)
“that”: NOT Matching
“the pattern”: (_HUMAN)|(_REVERSED)|(REV_)|(CON)|(con)
Select with the following parameters:
param-file“Select lines from”: peptides (output of MaxQuanttool)
“that”: NOT Matching
“the pattern”: (_HUMAN)|(_REVERSED)|(REV_)|(CON)|(con)
Cut with the following parameters:
“Cut columns”: c1
param-file“From”: out_file1 (output of Selecttool)
Cut with the following parameters:
“Cut columns”: c1
param-file“From”: out_file1 (output of Selecttool)
Generating a list of quantified proteins and peptides
Hands On: Group quantified proteins
Group with the following parameters:
param-file“Select data”: out_file1 (output of Cuttool)
“Group by column”: c1
Hands On: Group quantified peptides
Group with the following parameters:
param-file“Select data”: out_file1 (output of Cuttool)
“Group by column”: c1
Conclusion
In summary, the implementation of a quantitation workflow using MaxQuant represents a significant advancement in quantitative proteomic research. This approach enables precise measurement of protein and peptide abundances, enhancing our ability to unravel the complexities of biological systems. This workflow is instrumental in biomarker discovery, comparative analysis, and understanding differential protein expression by offering detailed insights into quantitative changes across different experimental conditions. Its capacity to generate accurate data supports a wide spectrum of applications, including disease research, drug development, and systems biology investigations. Furthermore, the MaxQuant-based quantitation workflow ensures data quality, enabling reliable and reproducible results. It serves as a vital step for quality control, allowing researchers to draw meaningful conclusions from proteomic experiments confidently.
You've Finished the Tutorial
Please also consider filling out the Feedback Form as well!
Key points
Quantified Microbial and Human peptides/proteins can be analyzed separately so that the results are more comparative.
Frequently Asked Questions
Have questions about this tutorial? Have a look at the available FAQ pages and support channels
Further information, including links to documentation and original publications, regarding the tools, analysis techniques and the interpretation of results described in this tutorial can be found here.
Feedback
Did you use this material as an instructor? Feel free to give us feedback on how it went.
Did you use this material as a learner or student? Click the form below to leave feedback.
Hiltemann, Saskia, Rasche, Helena et al., 2023 Galaxy Training: A Powerful Framework for Teaching! PLOS Computational Biology 10.1371/journal.pcbi.1010752
Batut et al., 2018 Community-Driven Data Analysis Training for Biology Cell Systems 10.1016/j.cels.2018.05.012
@misc{proteomics-clinical-mp-4-quantitation,
author = "Subina Mehta and Katherine Do and Dechen Bhuming",
	title = "Clinical Metaproteomics 4: Quantitation (Galaxy Training Materials)",
	year = "",
	month = "",
	day = "",
	url = "\url{https://training.galaxyproject.org/training-material/topics/proteomics/tutorials/clinical-mp-4-quantitation/tutorial.html}",
	note = "[Online; accessed TODAY]"
}
@article{Hiltemann_2023,
	doi = {10.1371/journal.pcbi.1010752},
	url = {https://doi.org/10.1371%2Fjournal.pcbi.1010752},
	year = 2023,
	month = {jan},
	publisher = {Public Library of Science ({PLoS})},
	volume = {19},
	number = {1},
	pages = {e1010752},
	author = {Saskia Hiltemann and Helena Rasche and Simon Gladman and Hans-Rudolf Hotz and Delphine Larivi{\`{e}}re and Daniel Blankenberg and Pratik D. Jagtap and Thomas Wollmann and Anthony Bretaudeau and Nadia Gou{\'{e}} and Timothy J. Griffin and Coline Royaux and Yvan Le Bras and Subina Mehta and Anna Syme and Frederik Coppens and Bert Droesbeke and Nicola Soranzo and Wendi Bacon and Fotis Psomopoulos and Crist{\'{o}}bal Gallardo-Alba and John Davis and Melanie Christine Föll and Matthias Fahrner and Maria A. Doyle and Beatriz Serrano-Solano and Anne Claire Fouilloux and Peter van Heusden and Wolfgang Maier and Dave Clements and Florian Heyl and Björn Grüning and B{\'{e}}r{\'{e}}nice Batut and},
	editor = {Francis Ouellette},
	title = {Galaxy Training: A powerful framework for teaching!},
	journal = {PLoS Comput Biol}
}
Congratulations on successfully completing this tutorial!
Do you want to extend your knowledge?
Follow one of our recommended follow-up trainings:
Questions: